
Your Complete Core Web Vitals Guide for WordPress
- •
- 11 min read

We all know the old saying — “It may be fast, but is it good?” Well, as a society, we seem to have lost the ability to wait patiently. Today, speed really does matter. If we can do something faster than our competitors we have a better chance to succeed.
Faster page loading, faster button response, faster cart flow, and faster payment results. Your website still has to be good, but speed usually wins. Speed has been a core principle of our business model here at Rocket.net since our launch.
Since Google released their Core Vitals and Core Web Vitals, we’ve been paying more attention to the performance and speed of our websites than ever before. In addition to Core Web Vitals, Google is measuring a growing number of user-centric response metrics, including Interaction to Next Paint (INP) and Time to First Byte (TTFB).
But how do you know for sure if your website is passing this user experience test? We directly reached out to Ian Pham at GTmetrix (a leading website performance monitoring tool) and asked them is GTmetrix accurate to properly measure Core Web Vitals?

Ian generously agreed to answer some questions for us.
Hey Ian – Maybe you can introduce yourself and tell us a little more about your background and your time with GTmetrix
Sure thing – My name is Ian Pham and I’ve been with GTmetrix since its inception in 2009/2010 (Oof, that sounds like forever ago!). I started off as a UI designer for GTmetrix and now, I’m in charge of overall operations and direction as the Platform Lead.
How did GTmetrix start?
GTmetrix started off as a small internal tool for our then parent company’s hosting business.
The goal was to show customers that their web sites were unoptimized on the front-end – some of them were submitting tickets about slow performance and we wanted to show them that the back-end server was not the issue.
We quickly threw together a tool using Google PageSpeed/Yahoo YSlow libraries and ran customers’ websites through the tool. It revealed huge image usage, too many requests, inefficient redirects, third-party resources, etc. – all stuff that we as a host at the time didn’t have control over. It was very revealing to customers to see how bloated their pages have gotten over the course of development.

Customers loved the resulting report and asked if we could generate reports for websites hosted elsewhere, submitting us multiple URLs to run, posting results on various forums, etc.
We knew we had a valuable tool on our hands, so with a quick redesign, a name selection and rejig of the codebase, we launched GTmetrix for the public in 2010.
My earliest memories of GTmetrix was about the time that people suddenly got actively interested in their site speeds for maybe the first time. There was Pingdom and GTmetrix, what was the reason for the shift into website performance?
I think the biggest reason for this was Google’s April 2010 announcement that they’d be factoring speed into search rankings. We were lucky that we launched around the same time – we shot up in traffic and grew our feature set to ensure site owners had what they needed to build a fast website.
The second sudden interest in performance happened roughly 2 years ago when Web Vitals was announced to be a search ranking signal for mobile websites . Luckily again, we had already been planning our shift away from the older PageSpeed/YSlow libraries and were months away from launching GTmetrix with Lighthouse metrics (including Web Vitals).
I know it’s still available under traditional reports, but GTmetrix originally had a total time loaded test and people got upset when this whole core web vitals thing was becoming a reality. How was the experience at GTmetrix when people started freaking out over the change?
There was definitely a surge in support tickets! When we switched over to Lighthouse metrics, lots of users freaked out about their scores “tanking”, and telling us to roll back the update. Many were accustomed to seeing their websites score in the green/A level and were upset that “all their hard work was rendered useless” with this new release.
In reality, this was a change in scoring methodology – the previous method of assessing page performance (i.e. relying on Fully loaded time) was outdated and focused more on how your website was built structurally – not how it actually performed in terms of user-centric metrics.
We eventually allowed Legacy Reports to still be generated if users wished, but Web Vitals focused on new metrics that really matter with regards to perceiving a fast loading website – it was imperative for GTmetrix to assess performance based on those metrics in order to stay up to date with the broader web performance world, especially if they are key metrics Google looks at for SEO.
While many understood this, there were others that just didn’t like change in general. There was a lot of education and back and forth discussion with customers on why they needed to make the switch to Web Vitals.
Speaking of which, what is your general take on Core Web Vitals, does it have any real impact on SEO as a ranking factor?
Improving SEO has always been touted as a reason for optimizing web performance. While we know that it does play some factor in improving SERPs (Google has said so themselves), we still don’t know how much, and we haven’t seen any clear and obvious examples of SEO improvement as a result of performance optimization alone.
However, what we’ve seen clearly and obviously when users optimize performance, is improvement in:
This should be reason enough to put a priority on web performance over any SEO benefits.
We’ve always said to optimize web performance for your users, not for SEO alone.
From your experience, what is the biggest challenge for non-technical folks to improve their Core Web Vitals?
Anything JavaScript related. JavaScript is an integral part of practically every website these days and it is quite easy to add JavaScript functionality to a site, especially if you use a CMS like WordPress (for example, through plugins). However, optimizing JavaScript is an entirely different story and JavaScript downloads, parsing and execution (both self-hosted and third-party) are often the primary culprits for poor performance.
Some of the JS optimization best practices (like code splitting, removing duplicate modules, lazy loading third-party resources with facades, etc.) aren’t things you can easily fix at the click of a button as they require knowledge of a website’s code base – developer expertise is pretty much a necessity here.
LCP, CLS, other? Where do most people falter when trying to improve their website performance?
The Web Vitals as a whole is an area most people generally struggle to optimize as each Web Vital caters to a different aspect of the user experience – LCP measures loading performance, CLS measures visual stability and TBT measures your site’s usability. Even if you can optimize LCP to some extent through caching plugins (and other relatively easy optimizations), optimizing CLS and TBT require more technical skills. CLS requires an understanding of viewports, how browsers render content, and what requests get loaded in what order. TBT, in our opinion, is an even harder metric to optimize as understanding JavaScript execution requires a higher level of technical expertise.
TTFB is another metric some people struggle with as it could be due to bad backend code or insufficient hosting resources. The ‘reduce initial server response time’ audit is one of the most flagged audits in GTmetrix Reports we’ve come across. That’s why it’s important to not have a low-end/budget hosting service powering your website – we’ve too often seen people pair a WordPress/WooCommerce/Premium Theme website with cheap hosting and wonder why their performance is in the red.
It’s being predicted that FID will be recalculated with the introduction of Interaction to Next Paint (INP) – How do you see that playing out?
It’s definitely an interesting metric to reveal insight on performance involving actual interaction, which is arguably more realistic than a non-interactive page load.
However, as it’s still flagged as experimental, most things Google flags as such still need time to mature. I remember when “First Meaningful Paint” was supposed to replace “First Contentful Paint” as a better representation of the first relevant render on the browser, but it proved to be too unreliable as a metric as testing went on.
Not saying that INP will follow the same fate, but we’re keeping an eye on it and seeing if it becomes stable enough before considering implementation into GTmetrix Reports.
I understand that GTmetrix has servers around the world to test from different locations, how does that work exactly?
We have a total of 82 test servers operating in 22 locations (7 Free and 15 Premium Locations) around the world. This is to ensure we pretty much cover every continent on the planet (except Antarctica of course). We have a global userbase, and these website owners also tend to have a global userbase so it’s imperative we give them the ability to see how location affects their site performance.
We have our own server infrastructure in our home location of Vancouver, Canada and use a combination of Azure and AWS virtual servers to provide near equitable hardware around the world. When a user selects one of our testing locations (e.g., Sydney, Australia), we actually load the page from our Sydney location using a real browser to analyze how the page would feel to a user visiting the page from Sydney.
What are the advantages of using GTMetrix vs Google PSI test?
GTmetrix and Google’s PageSpeed Insights (PSI) are both powered by Lighthouse – however, that is where any similarities end. Our testing methodology is entirely different as we focus on the “observed performance ” (i.e., we use a real browser to load the page and capture resulting data). PSI, on the other hand, focuses on “Simulated Performance” (i.e., they use a headless browser and simulated throttling/Lantern to simulate how the page would have loaded on an average device).
In other words, GTmetrix results are closer to what a real world user would experience loading your page on their browser.
PSI also doesn’t really allow you to alter any of the testing parameters, but GTmetrix lets you change the location, connection speed, device, and allows you to test under a variety of scenarios (e.g., Adblock, Cookies, HTTP Authentication, etc.).
Moreover, GTmetrix provides other features like Waterfall Charts (to correlate various timings and metrics with how page requests loaded), Monitoring and Alerts (automated testing at scheduled frequency and alerts to report when performance strays from expected profile), Historical Performance Tracking (through various Graphs and Charts), Report Organizations and History CSV downloads, etc.
While PSI is fine for spot checking your performance, GTmetrix is useful as a more reliable and long term performance tracking tool for users across all tiers.
What’s next for GTmetrix?
We’re working on some cool features that help you organize reports better, collaborate better as a team, and just understand your results better so you can make more informed decisions.
Our goal is to continue to help make web performance optimization easier to grasp and make it more accessible to both technical and non-technical users.
Thanks Ian, so much here that I didn’t know about the genesis of GTmetrix and how things have evolved over the years. I think readers will find this really helpful.
My pleasure for giving me the opportunity to tell our story, make sure to visit GTmetrix and let us know if you have any questions!

In addition to the planning, the build, the population, and the launch, your client’s websites need constant monitoring and optimization to keep them performing at peak efficiency. Payment gateways, CDNs, smart caching, programmatic advertising, edge servers – our websites are becoming more like rocket science every day.
So how do we know if our websites are running at 80% or 90% of their capacity? Right. We measure it.
“The GTmetrix speed check will show you a ton of information. However, you may want to compare your results using an alternate website speed check tool, like IsItWP Website Speed Test Tool or Pingdom.”
wpbeginner.com
GTmetrix is a product of Carbon60, and has been testing web speed since 2009. It’s an easy-to-use tool for monitoring and improving the performance of your website. Performance, as it relates to the load time and usability of your website, is the latest Google ranking factor in the SEO spotlight.
If you want to be listed in a useful position in any search results, you’ll (hopefully) have been paying attention to the performance of your website and those of your clients. If GTmetrix is still unknown to you, you will have heard of Google’s “Page Speed” along with “Pingdom;” two services which are particularly well known.
GTmetrix gives you an overview of what’s slowing down your website. It gives you various suggestions about how to improve your speed and performance. GTmetrix offers you two ways to do this.
First, by going to their website and entering the URL of your site. If you create an account, the testing you do here will be saved in your history. A nice feature.
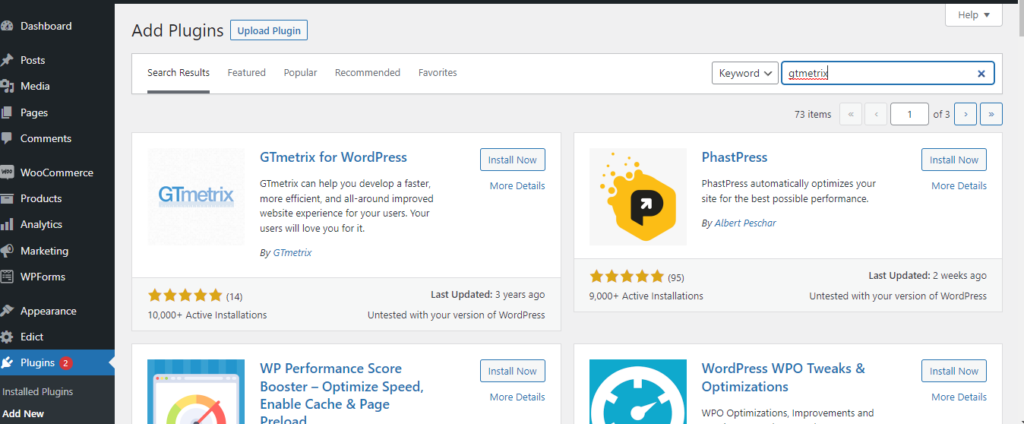
Alternatively, you can use the GTmetrix WordPress plugin. Using a plugin for your WordPress site takes a little longer than option A. You will need to install the plugin and create a free GTmetrix account. The account gives you the API keys for the plugin and a specific number of daily requests. The plugin only generates the older PageSpeed/YSlow reports however, so if you’re looking for Lighthouse metrics, stick to the GTmetrix website..
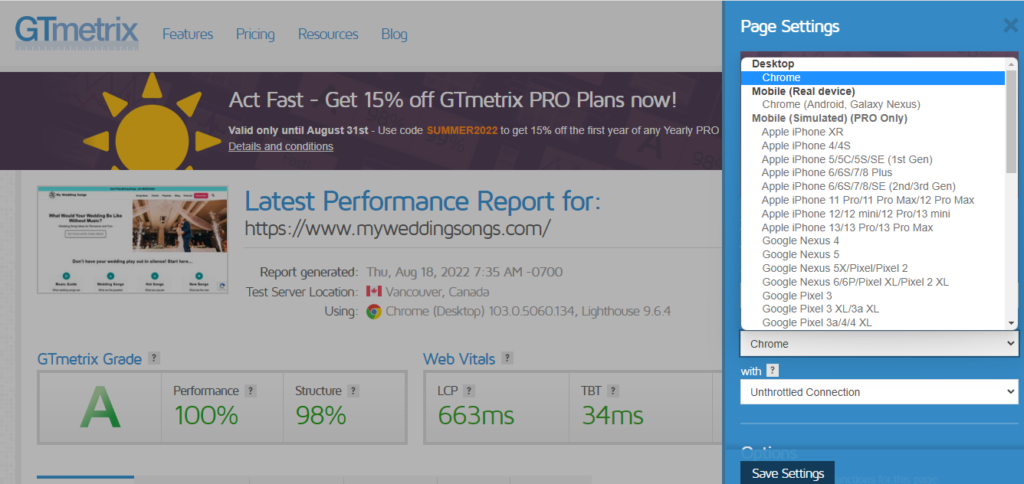
The default, free, testing settings for GTmetrix are Vancouver, Canada, Desktop, and a Chrome browser (image below)

Without registering for an account (Free or PRO), you will be limited in what you can test.

With a Free account you can take advantage of many more features.

You can sign up for a paid account, starting at 9 dollars a month, which offers unlimited requests and other features.
You can sign up for a paid account, starting at 13 dollars a month (discounts given on longer term plans), which offers higher volume of testing and more advanced features.
Sign up for a free GTmetrix account: https://gtmetrix.com
Set up a paid GTmetrix account: https://gtmetrix.com/pricing.html
Download the WordPress plugin: https://wordpress.org/plugins/gtmetrix-for-wordpress
Installing the GTmetrix plugin in WordPress is a great solution if you prefer to monitor your website performance without leaving your website.
Create a Free account, and generate an API key (below)
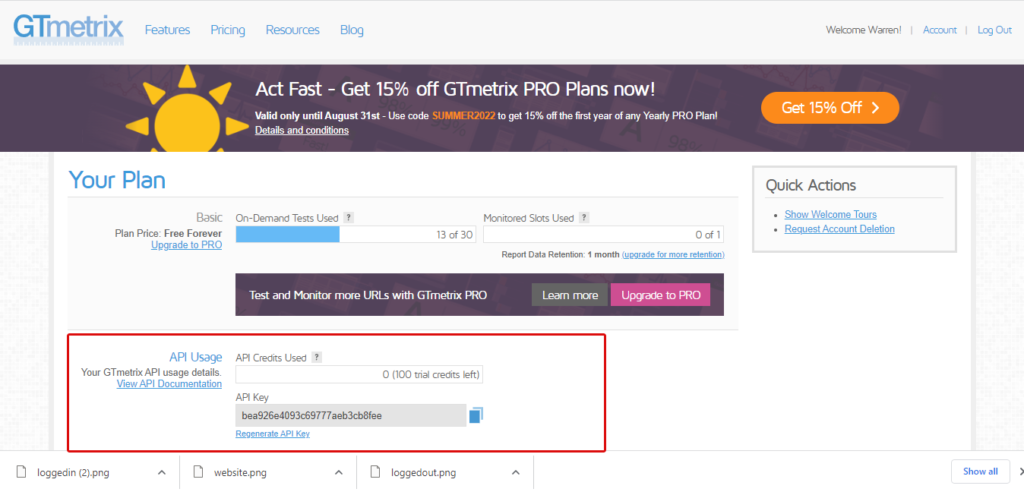
Log into your WordPress website and install the GTmetrix plugin
Add your API key, and the email address of your GTmetrix account

You can now begin to measure by testing your front page, or by entering a URL or the title of a page

Before we get into the tool itself, it would be a good idea to talk about how to run a website speed test. There are a lot of tools out there, including GTmetrix. Many are great, but they’re not very useful if you’re only checking your website speed once, and only specific pages.
As with any testing, you need to run many tests, over time. Experiment with different factors in order to get the best and most accurate results. Just because you pass the speed test now, doesn’t mean you’ll pass next month.
Don’t just test your main pages either. Every page on your website counts. People are trying to order a pair of shoes from your website on their phone, with minimal wifi, in a parking garage, on Saturday night, in Wichita. They are not sitting in your office just calling up your homepage on a desktop.
The performance of your website is subject to daily fluctuations and is influenced by various factors such as the number of visitors or the required and available resources of your hosting server.
To achieve the most accurate test results, you should:
Right out of the box, there is a useful difference between the reports from GTmetrix and other tools. If your clients want to be more in the loop regarding website performance, these reports will give them a clearer picture than will Google Page Speed Insights.
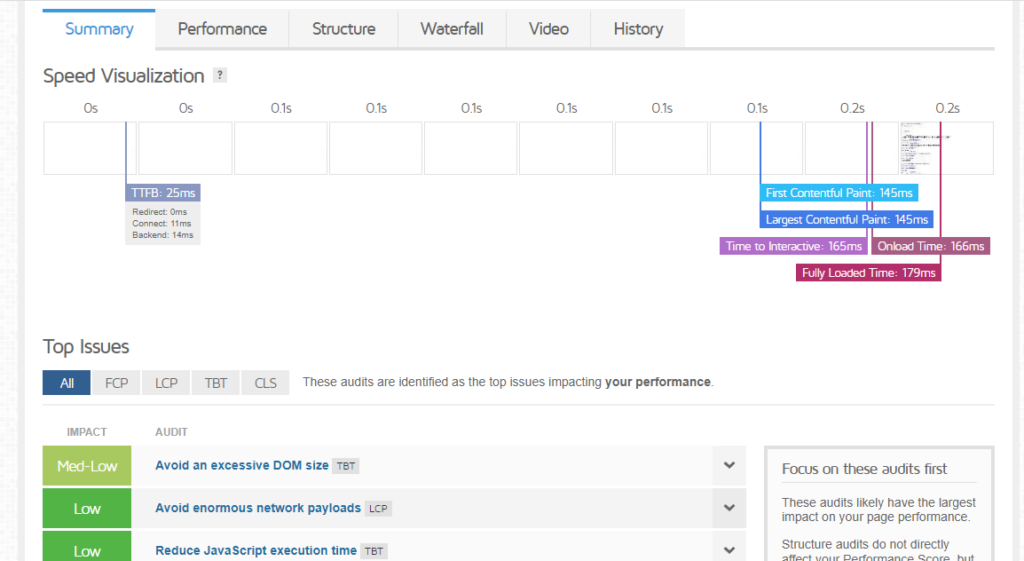
The Summary, Performance, Structure, and Waterfall reports are conveniently tabbed together with Core Vitals clearly visible. The (also free) Video and History tabs are right there in the interface too.
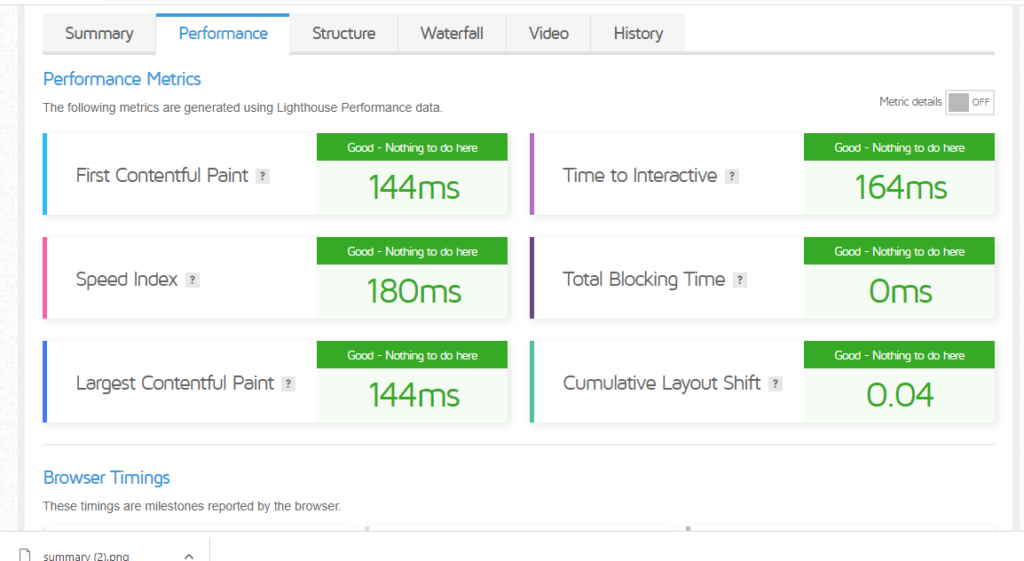
The Performance Report gives the performance metrics (web vitals) followed by Browser Timings

The Structural Report itemizes each audited problem, so you have a good overview of each actionable improvement you can make before the next performance test.

The Waterfall Chart gives you a request-by-request breakdown of your page load. The waterfall diagram shows in detail which factors influence your website’s speed. You can see how long a file requires, and in what order the files load.

One of GTmetrix’s more interesting features is a video of your website as it loads. This video can be embedded and shared with clients. (below) This is the feature that makes GTmetrix so valuable. In the video, the page structure is shown. But this simple trick allows you and your clients a clear differentiation between the measured load time and the perceived load time.

By far the best feature GTmetrix offers in both its Free and PRO plans, is the History Graph. The report is saved every time you measure your website. (below) Comparing the load time of your site over several days or weeks can be really informative.
There are 3 History Graphs that help you keep tabs of your page performance by tracking the following: Key performance metrics, Number of HTTP requests and Total Page Size, Page Scores

If you already use PageSpeed, or another performance monitoring tool, you may be new to GTmetrix. If that’s the case, you might already be answering this question for yourself. The features available in the free GTmetrix account are awesome!
If we’re comparing the two systems, then we’re comparing apples with oranges. GTmetrix gives you more of a hands-on feel to your testing.
Clients will be more than pleasantly surprised by the additional information they have on their website testing and performance, right out of the box.
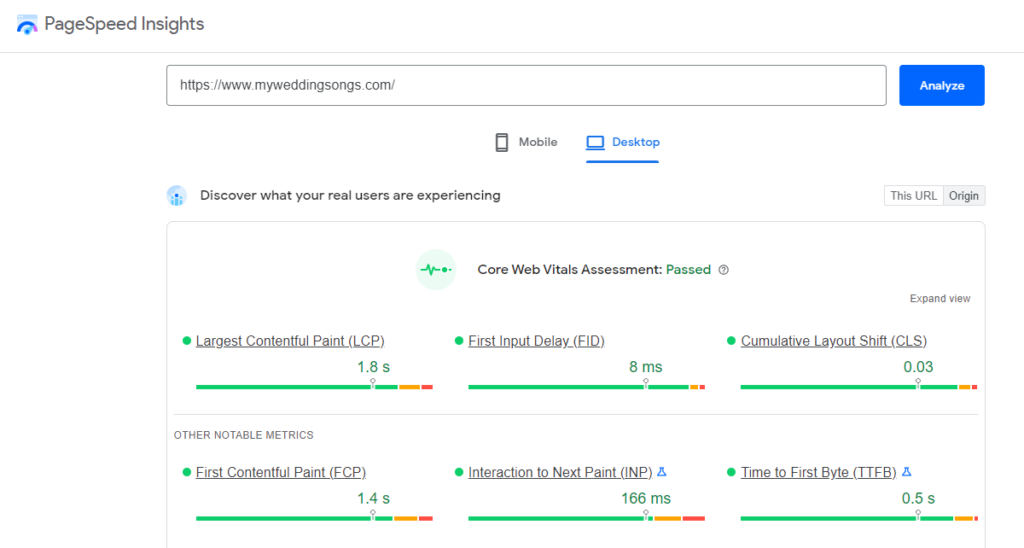
Google’s PageSpeed Insights is a tool that evaluates the loading speed as well as the behavior of a web page. It measures the mobile and desktop views and gives concrete suggestions for improvement depending on the results.
PageSpeed measures the loading time of a given URL, calculates a score and analyzes the website for potential improvements. The great thing about it is that any URL can be entered and checked for free, without the creation of an account.
GTmetrix is a website monitoring solution. It has been using Google’s measurements since 2020, including the Core Web Vitals. This is the industry standard for website performance measurement.
You can test your website with GTmetrix from a device and browser combination of your choice, which includes mobile phones. You do need to register to customize these options.
The main advantage of GTmetrix over PageSpeed Insights is that you can track the performance of your website over time, run experiments, and have a one-stop overview of your website’s performance.
There can sometimes be differences in the GTmetrix Performance Score compared with results in other tools. These differences are due to various factors: Lighthouse implementation, the testing methodology, location of the test, connection speed, hardware, etc.
As different tools use different methodologies and configurations, performance scores will vary. Lighthouse may be the common component, but there are differences in how Lighthouse is implemented.
PageSpeed Insights and web.dev are Google’s tools. They use Lighthouse in their own way. The key difference is that PageSpeed Insights provides Chrome User Experience (CrUX) data. This is actual user data, collected from Chrome browsers around the world, providing data on real user performance.
GTmetrix offers lab/synthetic tests. The analysis is performed in controlled environments and scenarios.
“GTmetrix may be a better option for companies and organizations with rapidly updating web pages or serve a rapidly changing market. This is because users can perform automated, scheduled monitoring, enabling them to gain updates on their webpage performance.”
techrepublic.com
GTmetrix is accurate, but the results and testing may be different to what you or your clients are used to.
GTmetrix testing is done with a real browser to load websites with an unthrottled connection (no usage thresholds) by default. Some of the testing options (location, connection speed and type, screen resolution, etc.) can be changed based on the test requirement and the user plan.
PageSpeed Insights and web.dev test use network throttling (usage thresholds) to simulate your page load under different network conditions . In addition, PageSpeed Insights and web.dev use Lantern, which models page activity, and simulates browser execution in order to estimate performance metrics.

Page speed performance report in GTmetrix (above) and PageSpeed Insights report from Google
Both GTmetrix and PageSpeed Insights deliver valuable sets of relevant web monitoring features and analysis.
GTmetrix may be a better option for you if your client’s websites are regularly updated or they serve a rapidly changing marketplace. You can perform automated, scheduled monitoring with GTmetrix, providing you with regular and archived updates. You can also define the internet connection type and speed, which you cannot do in PageSpeed Insights.
PageSpeed Insights tool may be better if your clients are fairly new to website performance monitoring. They can take advantage of PageSpeed’s online access and simplified improvement suggestions.
“GTmetrix is one of the best alternatives to PageSpeed Insights when it comes to measuring the performance of your site. At WP Rocket we use GTmetrix daily, along with other performance testing tools, to help our customers audit their sites and making the most of its recommendations.”
wp-rocket.me
A 100/100 score is pretty much unworkable, especially if you use custom features on your website. A score of 80 to 90 is desirable for both the search engine and your visitors.
Fun fact: 80% of all Fortune 500 home pages have a performance score of less than 50 (storyblok.com)
In the Structure Report, GTmetrix gives you a list of all audits, passed or not. You can then work your way through each actionable item and go, over time, from yellow to green – needs improvement to good.
The Structure Report gives you an itemized listing of each audit. (image above). Click on one open to reveal all details pertaining to that audit in order to see what needs improvement. (image below)

The first thing you can do to improve your website performance is at the server level. Is your web server slow?
Possibly. Our advice is to use a CDN web service
A Content Delivery Network is a network of many servers, like Cloudflare, scattered around the world that hold your files. This allows your visitors in other countries, or continents, to get the files for your website much faster than a conventional server.
What else can you do, like right now, to improve your website speed?
“GTmetrix is one of the most popular ways to test WordPress performance (or the performance of any other type of website). However, it throws a lot of data and suggestions at you, so it can be tough to know how to use it most effectively.”
winningwp.com
GTmetrix has been testing mobile results since 2013. Back then, two Samsung Galaxy Nexus phones comprised their Mobile Testing suite, allowing users to generate GTmetrix reports based on actual page loads on these devices. They’ve come a long way since then!
It’s clear that we have long passed the “mobile moment.” Back in 2011 sales of mobile devices surpassed desktop computers. Only two years later, Facebook reported that more people accessed its platform with a mobile device than a desktop computer. Today at least half of our website traffic comes from mobile devices. Good PageSpeed’s default test, as Google’s search algorithm itself, is mobile first. Google presumes, as we should, that people will visit our websites on a mobile device.
“GTmetrix PRO users have access to mobile testing, both, through a real hardware solution (Chrome Android, Galaxy Nexus, Vancouver only), and our Simulated Devices testing, which enables you to test and monitor your page with more than 30 different devices and variants.”
GTmetrix
GTmetrix offers two types of mobile device testing:
Log into your GTmetrix account and enter the URL of the site you are testing. On the right-hand side, click on Page Settings

Log into your account, or use the free version to test your website performance. Some Page Settings can be adjusted with the free version. Other settings require a PRO Plan.

Using Page Settings, you can then choose the city, the browser and device, and the internet speed. The free account offers a selection of options, which can be increased with the PRO version.

You can then choose the browser and device and the internet speed. The free account offers a selection of options, which can be increased with the PRO version.
Yes, GTmetrix can tell you if your server is slow and that’s a good thing. There are three important factors you can influence that will increase the loading time of your website:
Time to First Byte” (TTFB or First Byte Time) is one of the first values that can be measured on the way to a fully-loaded website and represents the time taken to establish a connection to your server and then receive the first byte of page data back.
In GTmetrix, this is the total time spent redirecting (if any), performing DNS lookups, socket, SSL negotiations (handshakes), and waiting for your server to generate your page. If you’re measuring your website’s Google Core Web Vitals then TTFB is kind of a big thing.
The longer it takes to get data from the server, the longer it takes to display your web page. Google recommends keeping TTFB under 200 milliseconds. At Rocket, we’re proud that our platform has a global average TTFB that is less than 100ms unless certain locations have network issues.
The significance of TTFB is it’s the most important metric that nobody thinks of for Core Web Vitals. That makes it the most important metric for your websites. Why? Remember, speed wins!
GTmetrix measures not only Google Core Web Vitals (first image below), but also the speed of your server response as seen in the TTFB (second image below)
The Free GTmetrix account allows you to test a limited number of URLs on a weekly basis, and you can monitor one URL either daily, weekly, or monthly. The GTmetrix PRO plan allows further URLs to be monitored, and at an hourly frequency.
As we already wrote, every page on your website counts. Some pages may be heavier than others, or be causing the speed problem you are encountering. GTmetrix doesn’t perform bulk testing but you can test each URL and compare the performance of different pages.
After you have generated a report for a URL, click “Compare” in the top right. You can then compare another URL with the one you previously tested.

Enter the URL you want to compare with the report just made, or directly paste the GTmetrix Report URL of another report you wish to compare. The Compare screen with the comparison results automatically appears.

If you want to compare further URLs, click the “Add another URL” button – you can compare up to 4 unique URLs.
If you’re not using GTmetrix yet, you should ask yourself why. The basic version is free. Speed is good. Free is good!
Compared with other tools, GTmetrix is fairly easy to use. If you are a beginner, you can learn it pretty quickly. Scores and recommendations are generated using Lighthouse (or PageSpeed/YSlow for Legacy Reports), augmented by GTmetrix’s own expertise and proprietary formulas.
The user-friendliness of GTmetrix is very high. The UX is quite simple and the clear display of KPI values is a definite plus. The range of features including Page Performance Tracking to World Wide Servers, Videos, and Advanced Analysis Options is huge. In addition to the basic values such as the website speed and page size, you also get a great number of optimization tips.
Our team of experts is standing by. Most website owners have switched hosting providers multiple times over the history of their site. We’re confident that you won’t look back once you make the switch to Rocket.net.
The best customer support 24/7, super fast speed, ease of use, and access to top tools and industry-leading resources should always come standard. We’re revolutionizing the way your WordPress site gets served up to the world, and we look forward to partnering with you in growing your business.